|
An Unbiased Overview of Guns in America By Benjamin Clark via houseclarkreviews.com, March 2, 2019 Introduction I recently conducted a 60 day internet/literature survey on guns in America. I read a vast array of articles on every gun related subject imaginable. Perhaps due to a built-in Google bias, I was directed to mostly anti-gun rights articles and websites. Obviously the anti-gun activists have found a goldmine in lobbying against gun rights and for increased gun controls. The visuals are slick and professionally made, the internet memes squarely aimed at the tech-savvy millennials, and the donations box always handy for your credit card information. Since I was aiming for a fairer and more balanced approach, I located key source databases such as the FBI uniform crime reports, FBI NICS reports, DOJ & GAO reports, Cato Institute studies, Harvard University and the United Nations Office of Drugs and Crime annual reports. From these objective studies and downloadable databases I was able to construct my own, unbiased gun metrics, and separate fact from fiction. It is not the purpose of this article to offer remedies and solutions for gun violence. There are scores of proposals out there, ranging from good to horrible knee-jerk reactions. It is best for the state legislatures to sort them out based on merit and local needs. As a gun-owner and friend of the Second Amendment, I support good public policy based on objective research, informed by a proper understanding of individual rights — including the right to self-defense. If we’re going to engage in gun violence research, let’s do it right — by recognizing both the positive and negative aspects of civilian firearm ownership. International homicide comparisons
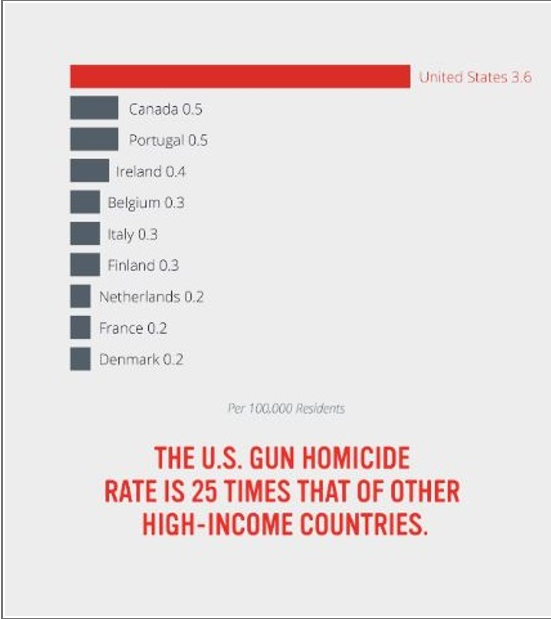
The more realistic “Neighborhood” comparison that takes into account open borders and mass illegal immigration 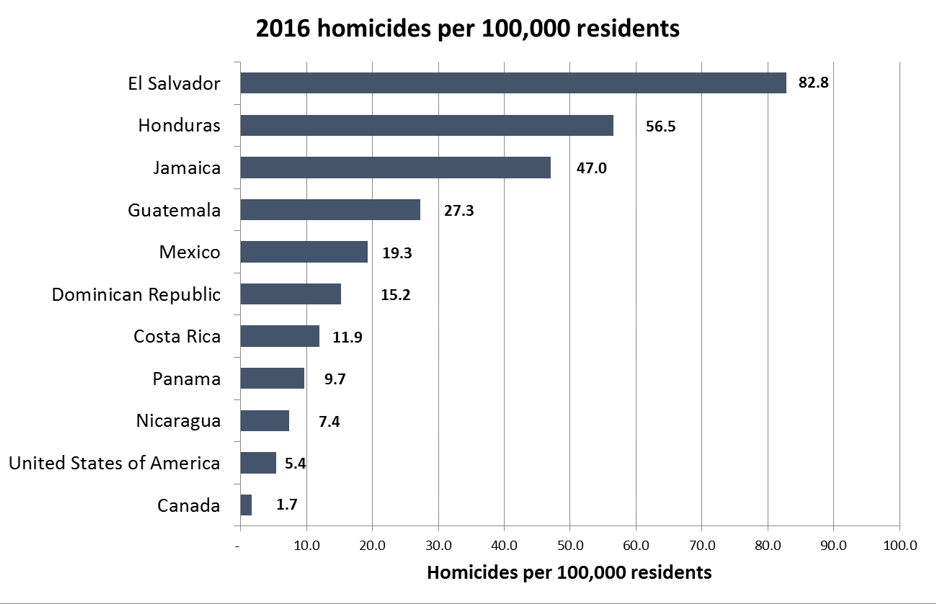 Source: UNODC homicide report for 2016 The claim that America is unsafe due to guns is false. It depends on how you analyze it. Mexico has a homicide rate nearly 4 times the American rate. How is this possible when firearms are illegal for Mexican citizens? Answer: Guns laws do not matter to violent criminals. Americans murder each other 3 times the rate in Canada, but the US has a few states with matching demographics that delivered murder rates equal to, or lower than, Canada’s 1.7 murders/100,000 residents (North Dakota, Maine, and New Hampshire). Untangling Murder and Suicides The Myth: Everyday there is over 100 gun deaths in America. The 100+/day statistic is the worst case scenario because it tangles up 23,000 suicides with 17,400 murders; two completely different animals. From a public safety standpoint, the focus should be on homicides, not suicide which is a mental health issue. Let’s untangle suicides and murder then recalculate the daily average. The most recent data I found on suicides is the 2016 US – CDC Wonder database. Note that suicide by firearm exceeds the total murders, by all weapons and methods. 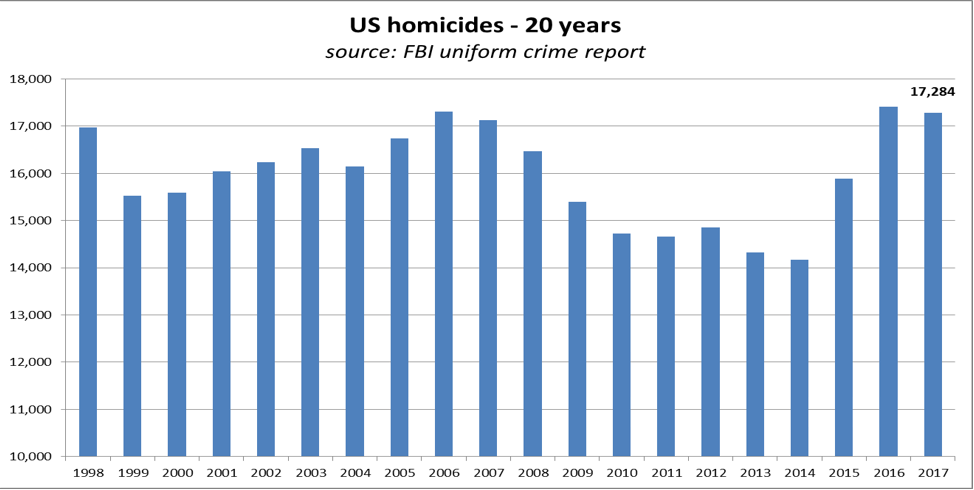 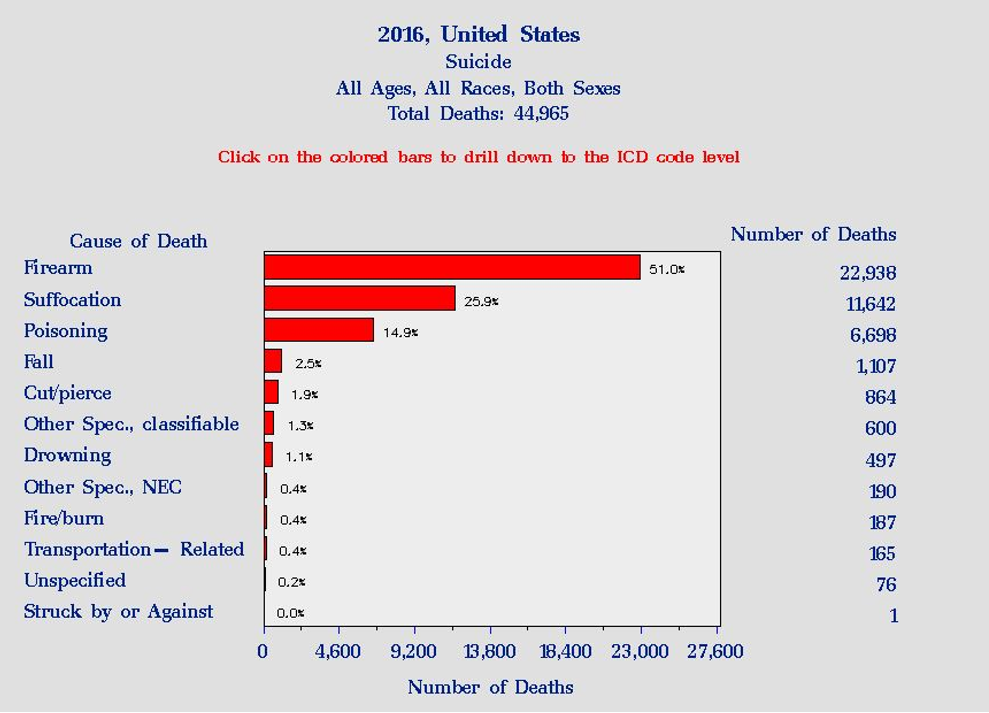 In 2016 the total US homicide tally was 17,413. The FBI also tracks murders by type of weapon, or method, used. Firearms account for a fairly consistent 70% of the murders, with the handgun being the favorite murder weapon by far. You are 19 times more likely to be killed with handgun than a rifle of any kind (see FBI murder weapon data below). 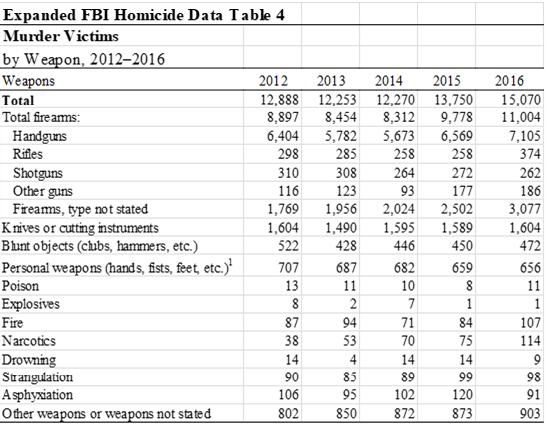 In 2017 I estimate that the violent deaths by firearms in the US to be (17,284 * 70%)/365 = 33 deaths/day. An alarming statistic, but a far cry from the 100+ gun deaths/day often quoted by anti-gun, left wing organizations. What are the public safety positives of gun ownership? Myth: America has too many gun and the guns are not worth the risk. Any study of “Gun Violence” should also include how guns save innocent lives. One tip off that you are at an anti-gun propaganda website is the absolute silence on Defensive Gun Uses (DGU) and violent Home Invasions. Home Invasions and DGU data is important and must be included for a balanced, unbiased study (see bar graph below). The only place I have discovered this verified data is at the website for the organization Gun Violence Archive (GVA). The rest is anecdotal or based on controversial studies (CDC surveys in the 1990s). The fact is, we really do not know how many DGUs there are each year. But first, let’s get things straight – the DGU incidents found at GVA include civilians only. Police incidents are not in the tally. Many social scientists believe the DGUs are vastly under reported, but the 4-6/day as documented by a leftist gun website GVA is good enough for me. You can argue about the numbers all day, but my right to self-defense does not depend on your numbers and statistics. It is also obvious that due to large increases in concealed carry weapon permits (aka CCW), an increase in DGUs is likely to follow. This is a good area for future academic study. The good news on Home invasion is the 20% decrease recorded in 2018. We can only hope it continues to drop. The GVA data only includes home invasion crimes that involve a firearm. Sometimes the criminal carries a gun, and sometimes the home owner is armed, and on occasion both parties are armed. If the home owner is armed and is successful in warding off the criminal, the incident is also counted as a DGU in the GVA database. Also GVA admits it under reports home invasions because many do not involve a firearm. The home owner can often scare off a criminal by merely turning on the outside lights, or confronting the criminal with a weapon other than a firearm. For more details on DGU in America see the Cato Institute Report, Tough Target. 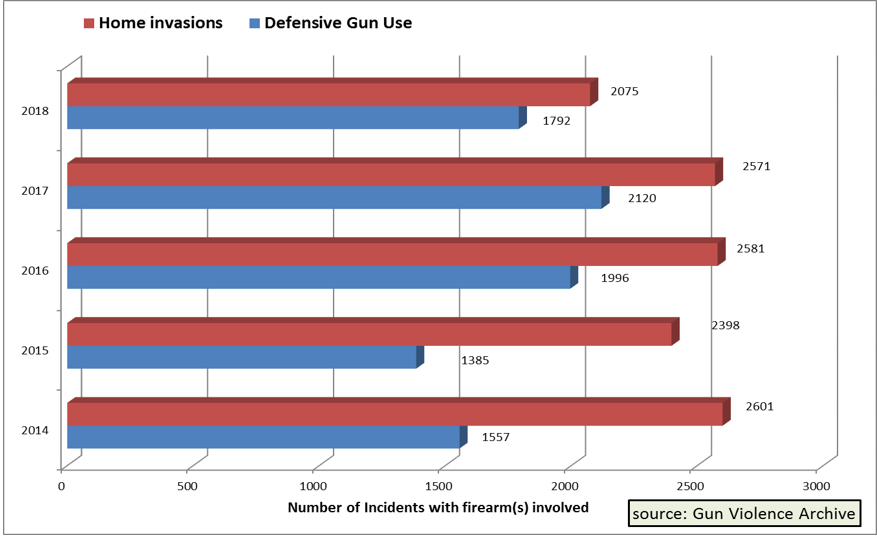 The GOOD, the BAD and the UGLY Myth: There is a clear relationship between more gun control legislation and less homicide or violent crime rates. Does more Gun Control actually curb Violent Crime? To focus on gun sales, the major difference between states with so called “strict” gun control and the other “gun freedom” states is the inclusion of increased background checks on private sales (gun shows, internet, friends & family members). This is the much heralded, by the left, state-mandated Universal Background Check system. Without diving too deep into the weeds of Gun Laws of the various 50 states & Wash DC, I offer a brief summary: All states use the FBI NICS system for the sale of firearms by a FFL (federal firearm license) dealer. Twenty states and Washington DC have extended the FFL dealer background check requirement to at least some, or all, private sales. Eleven states (California, Colorado, Connecticut, Delaware, Nevada, New Jersey, New York, Oregon, Rhode Island, Vermont, and Washington) and the District of Columbia require universal background checks at the point of sale for all sales and transfers of all classes of firearms, whether they are purchased from a licensed dealer or an unlicensed seller. Two more states, Maryland and Pennsylvania, require point of sale background checks for handguns but not for long guns, like rifles and shotguns. Instead of a point of sale background check, three states (Hawaii, Illinois, and Massachusetts) require all firearm purchasers to obtain a permit, issued after a background check, in order to buy any firearm. Four more states (Iowa, Michigan, Nebraska, and North Carolina) have this permit and background check requirement for the purchase of all handguns, but not long guns. For detailed information on all the various state gun laws, I recommend this book found at gunlawguide.com. Let’s once again refer to the verified facts in the 2017 FBI uniform crime report and review homicides by state. The states are divided into two groups – 1) The Good – States below the US average (5.3 murders/100,000 residents); 2) The Bad – States above the US average murder rate. The third and last group is called The Ugly. It includes the five most dangerous, violent cities in America. Let’s begin with a graph of the states with the lowest murder rates. 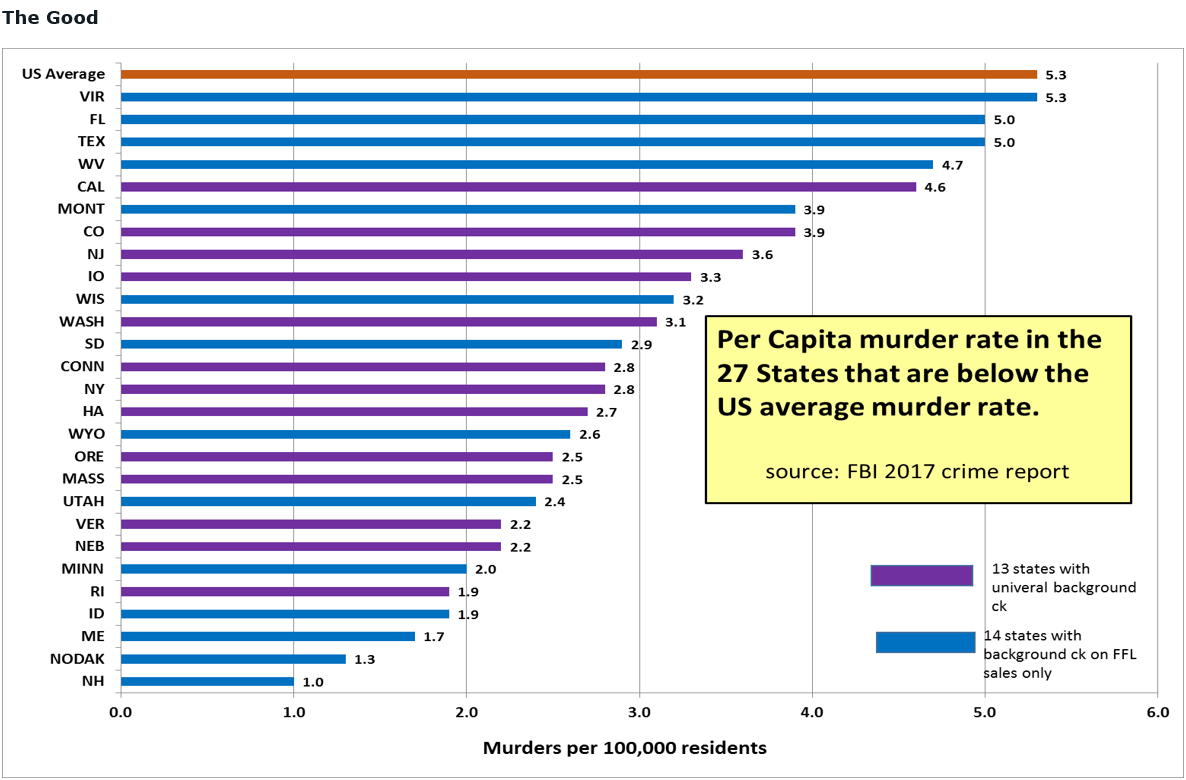 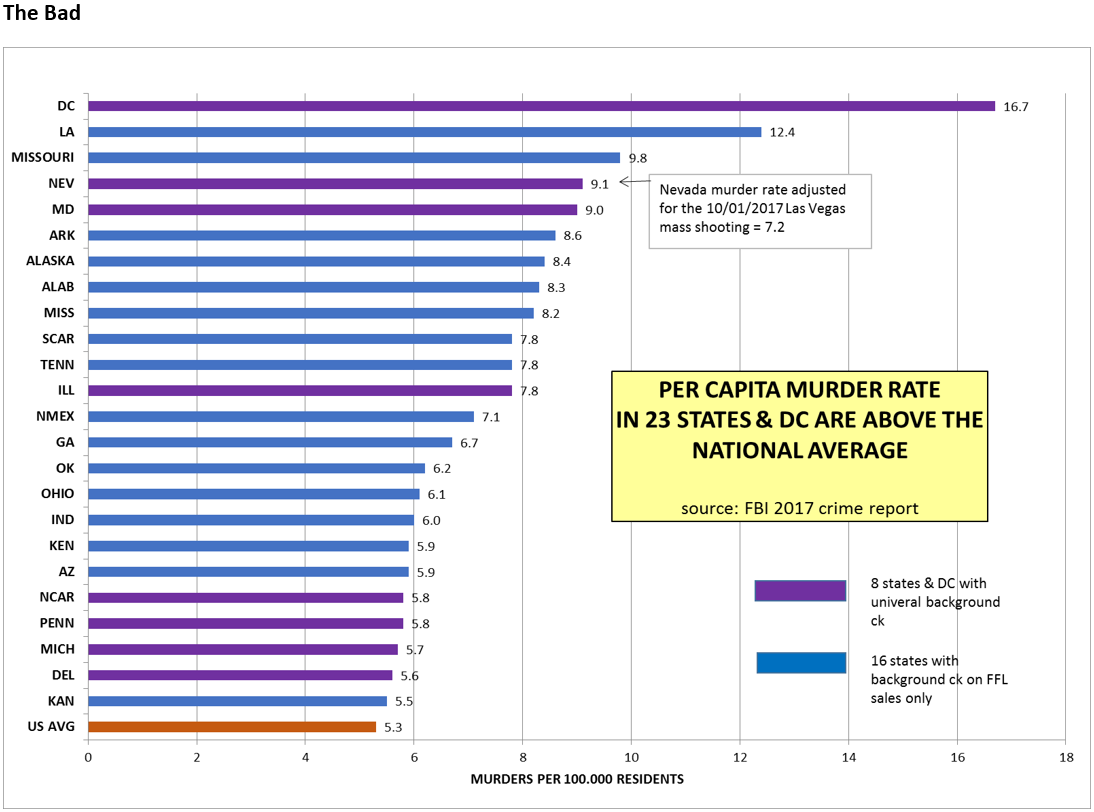 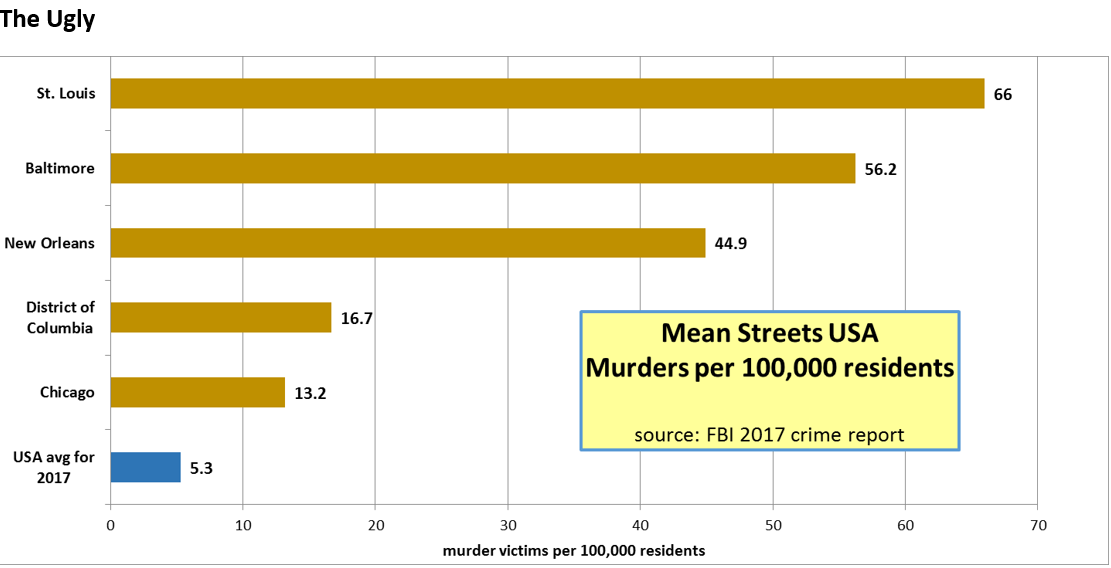 The facts do not support the Myth that strict gun laws translate to low violent crime rates. 4 out of 5 states with the lowest murder rates do not have “strict” gun laws. 3 out of 5 states with the worst murder rates have strict gun laws. When ranked against the states, Washington DC has the worst murder rate by a wide margin – three times the national average. Washington DC rarely sees a gun law it does not love. The high murder rates in some of our large cities resemble some of the most dangerous countries of Central America and the Caribbean; hence, lending additional credence to my “Neighborhood Comparison” method. In the major cities above, gang violence contributes up to 90% of homicides. The gangs distribute drugs as well as black-market firearms. It is silly to expect that passing more laws will cure the gang epidemic in America; it, unfortunately, will mainly impact the law abiding gun owner. The much ballyhooed “Gun show loophole” appears to be irrelevant to the actual crime data. The reason being criminals rarely obtain firearms at gun shows. A 2016 DOJ prison survey showed that the majority of firearms used by felons were obtained on the Black Market, stolen or a “Straw Purchase”. Less than 1% were purchased at a gun show. Risk Management of Legal Gun Sales Myth: More guns equate to more gun deaths. The FBI National Instant Criminal Background Check System (NICS) is the administrative workhorse for gun control/risk management in America. Also the NICS data is used as a broad brush method for tracking firearm purchases. 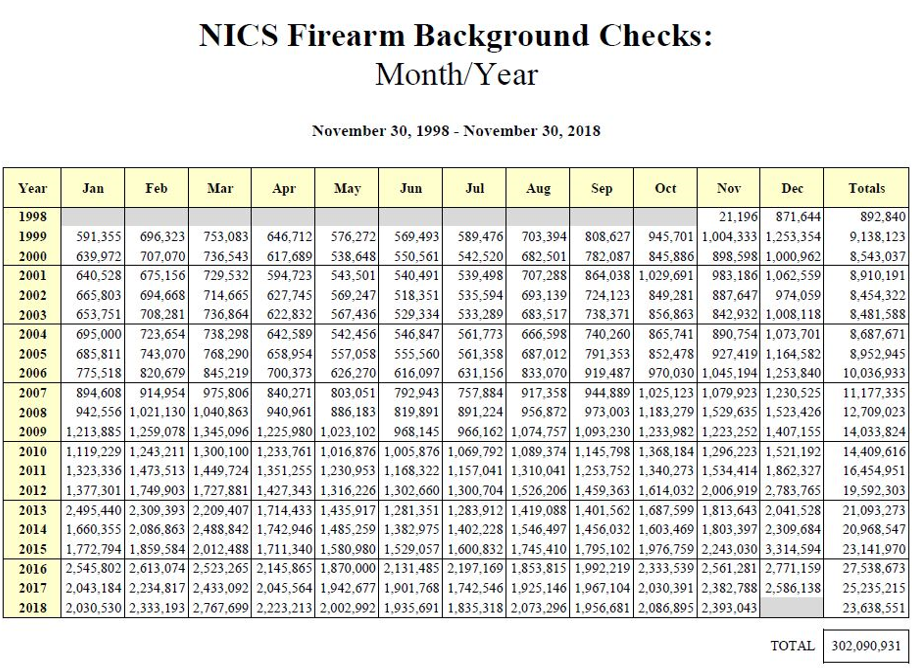 The NICS background checks can predict trends in gun sales but is not a 1:1 comparison for two reasons. Firstly, multiple and concurrent firearm purchases can be covered by one background check. Secondly, to qualify for a new CCW permit or renew/ update an existing CCW permit a new background check is required. It is not unusual to have 1 million/ month NICS checks for CCW permits. National Shooting Sports Foundation’s (NSSF) calculates actual gun sales after factoring in multiple sales and subtracting all other administrative uses. In all, 2,517,286 NICS background checks were conducted in December 2018. To quickly update the above graph, the total 2018 NICS checks = 26,155,837. The NSSF estimates actual gun sales for 2018 at 13.1 million, or about 50% of the 2018 roll up of NICS. Gun sales have gradually declined since 2016 when firearm purchases hit a high water mark of 15.7 million. From a macro perspective, the trend in gun sales correlates with trends in NICS checks. In comparing 2006 vs 2014, a 100% increase in NICS checks indicates a 100% increase in gun sales. According to the anti-gun theory, homicides should also increase a proportional amount in the same time frame. Is this true? Once again let’s refer to the facts in the FBI 2017 uniform crime report. The total homicides in 2006 were 17,309; in 2014 US homicides dropped to 14,164 (a 20 year low). In summary a 100% increase in legal gun sales (2006-2014) had no ill effect on the US homicide rate which dropped by 18%. The myth is busted. In the last few years there have been some high profile killings that revealed a few weak links in the NICS system primarily in regard to data management and collection by the various states and the Department of Defense. The fact remains that not all the relevant crime data is making its way to the FBI for entry in to the NICS system resulting in missed gun sale denials. The House has already OK’d a NICS fix, and Sen. John Cornyn is leading the effort in the Senate in a bipartisan bid backed by President Trump and the National Rifle Association to approve funds for the NICS upgrade. Gun sales myth #2: I find it appalling that virtually anyone can purchase a firearm with little effort, money, or time in the US. (Professor Meloy via Psychology Today, April 2014) Hold on there, Prof. If Miss Jones goes into a FFL gun dealer, is of lawful age, a legal resident, and passes the NICS background check for purchasing a firearm (non- Class 3); then why should it be a hassle? It is her right under the 2nd Amendment. Maybe the good prof is talking about a black-market gun sale which is a policing- criminal justice issue and does not belong in a normal gun rights conversation. In any case, not everybody walks out the store with a firearm. The graph below is a roll up of the 1.3 million NICS gun sale denials, up to 2015. The denial rate is < 1%. 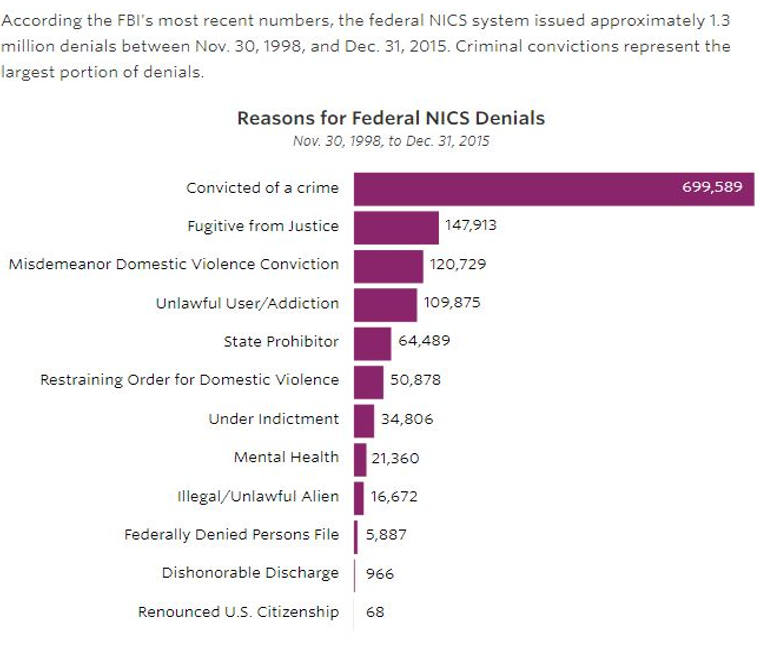 The 12 denial categories listed above are clear and straightforward, save one: Mental Health. A database system is effective only when accurate, timely data is correctly input into the system. Much mental health data was missing from the NICS system for several years. In 2007 at the Virginia Tech campus, the nation got a bloody, horrifying wake up call. Seung-Hui Cho bought a handgun, despite his disqualifying mental health record, and went on a killing spree: killing 32 and wounding another 23. It was discovered later that Cho’s mental adjudication was not entered into the NICS database. Cho used the Lie and Try loophole in the system, and gambled on his background check not flagging him for mental health denial. His gun purchase was NOT legal because he lied on the ATF form, but it was commonly reported by the press as a “legal” purchase. The penalties for lying on the ATF form are serious but generally not enforced (see GAO September 2018 Report titled - Few Individuals Denied Firearms Purchases Are Prosecuted). Unless you live in Oregon, Penn, or Virginia, you can lie your ass off on the form, get denied on the FBI or state background check, and then walk out the gun store as if nothing happened. Since Cho’s murder spree, numerous mental misfits have obtained guns due to the missing mental health records that would have tripped a NICS denial. On the positive side, the states and DOD are pushing to update the NICS database (see FBI graph below) and many states are also considering “Red Flag” and/or “Extreme Risk” laws to legally disarm those who have been deemed by a judge to be a dangerous public threat. 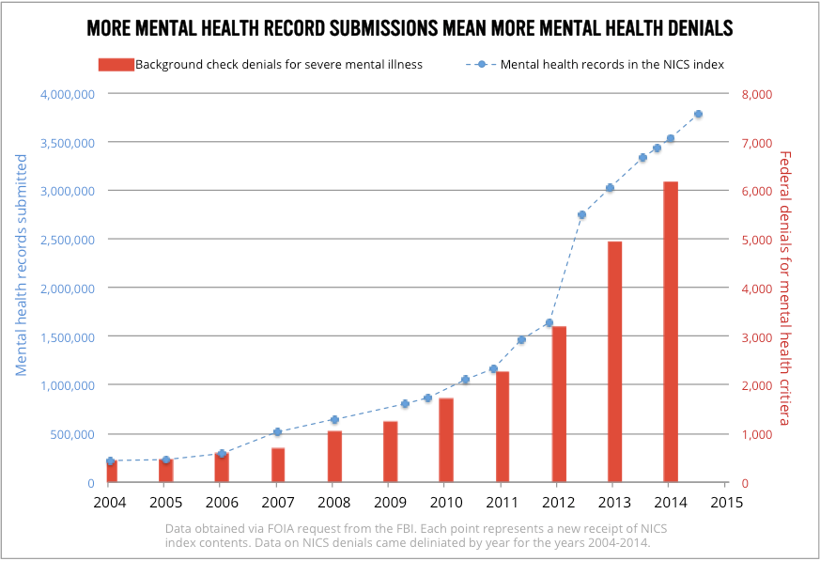 The Madness of Mass Shootings in America Myth: It is misguided to causally connect mass shootings with mental illness and, more importantly, it is unlikely that doing so will have any effect in preventing such incidents from happening again. Social Scientists, Grant Duwe and Mike Rocque, destroyed the above myth in a landmark article titled: “Actually, there is a clear link between mass shootings and mental illness”. This scholarly paper first appeared in LA Times, Feb 23, 2018, and provided a succinct overview of gun violence and the link with America’s mental health crisis. The findings of the research were astounding: at least 59% of public mass shootings were carried out by people either diagnosed with a mental disorder or demonstrated signs of serious mental illness prior to the attack. Mother Jones, a far left magazine, puts the number even higher at 61% in a 32 year study. So when we talk about mass shootings, what exactly fits the description? Like Mother Jones, I use the DOJ definition of the Active Shooter. “The attack occurs in a gun-free public space, often but not always, against innocent strangers. It usually stops when the shooter is confronted with armed resistance and either surrenders or kills himself. The attack results in multiple homicides in which four or more victims are murdered with firearms, within one event, and in one or more locations in close proximity.” This is a vastly different type of crime than a drive-by gang shooting, or a domestic violence incident where a love-sick misfit murders his ex-wife or girlfriend’s family. The Gun Violence Archive made up their own definition of mass shooting that is simply based on the number of people shot. I disagree with this method because by lumping every shooting together it minimizes the peculiar motivation of mass shooters. Violent crime involving guns has been happening forever in this country, but mass shootings are unique, the perpetrators motives aren’t always known but they’re never the same as those of an armed robber, feuding gang member, or angry drunk and should be in their own category of crime. Below is a graphical summary of the 32 years of Mother Jones data on mass shootings. We are now in seven year spike in mass shootings that began in 2012. It is beyond the scope of this article to explain the sudden increase. For those of you interested in digging deeper into the causes of the rising tide of gun rampages, I suggest reading, How the Media Inspires Mass Shooters by Mark Follman via Mother Jones. Although the killings amount to less than 1% of US homicides, the public impact is substantial. A 2016 Harvard study estimates that the per-death impact of mass shootings on new gun bills introduced is about 80 times as large as the impact of individual gun homicides in non-mass shooting incidents. 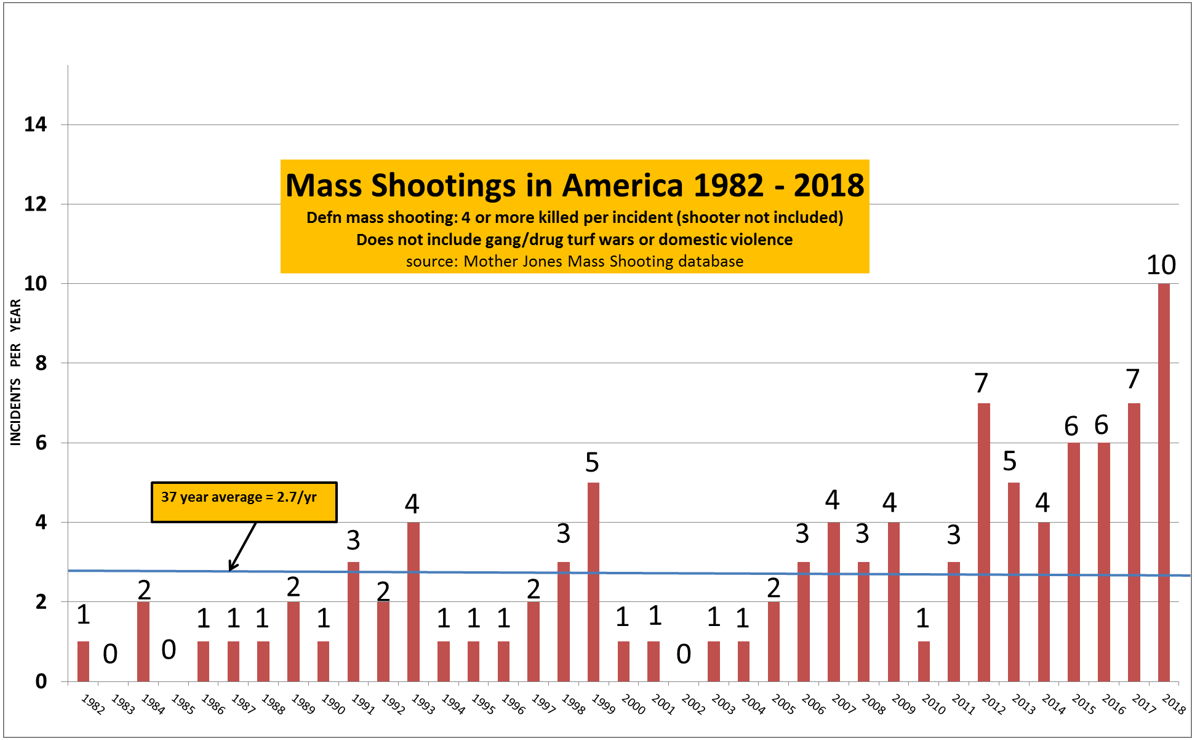 Mass shooting myth #2: The mass shooter is an angry white male. They got it half right with Male. It is inaccurate to label mass shooters as “predominately white”. That was the case in the past, but not anymore. In the past nine years, 55% of mass shooters were non-white males. Source: Mother Jones mass shooting database. 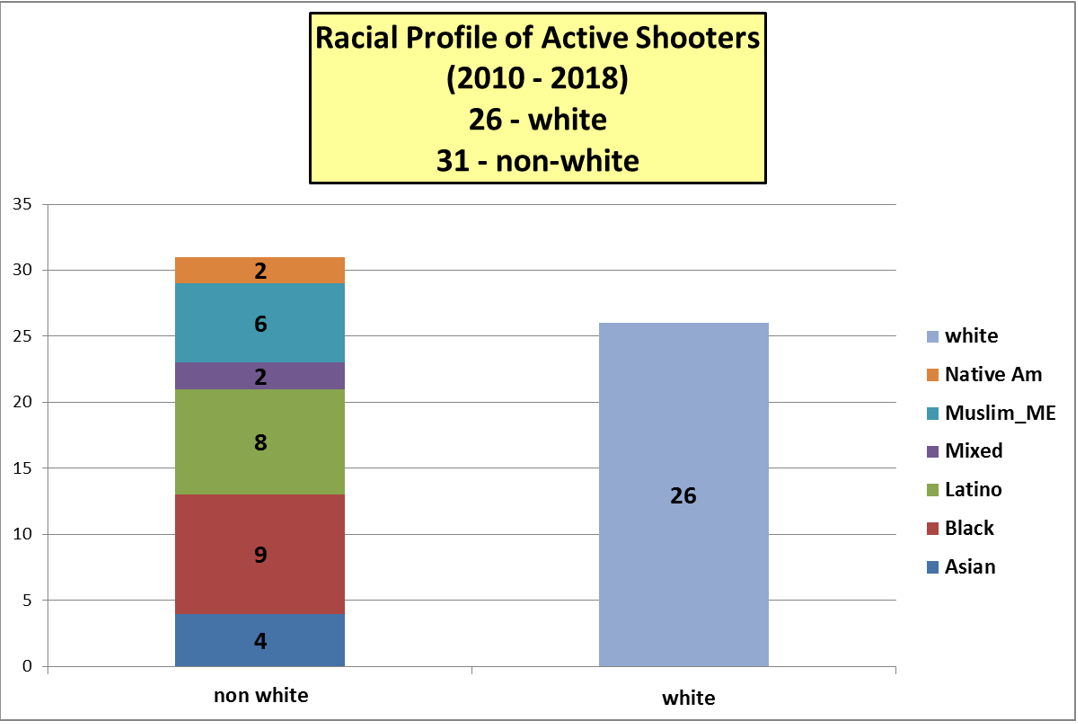 Conclusion The debate between gun rights Patriots vs anti-gun activists is not going away. Beware of the half-truths and untruths being circulated as gospel. Do your own research and dig down to the raw data as much as possible. You might be surprised by the facts you discover. I know I was.
0 Comments
|